
DSTAT - Resource Monitoring
When you want to see the information or statistics of system such as IO devices, CPU and network, dstat can be the one that is easy to utilize. dstat is a monitoring tool that shows resource utilizations in real time. It facilitates system monitoring while performing like vmstat, netstat, iostat, etc.
How to install?
Ubuntu and debian
$ sudo apt install dstat
CentOS and Fedora
$ sudo yum install dstat
macOS
$ brew install tmux
How to use?
$ dstat
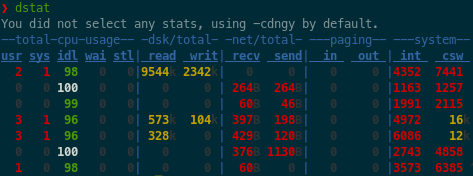
The default options of dstat is -cdngy, showing the following statistics.
- CPU usage (-c, –cpu) : CPU usage by user processes, system processes and CPU idle time. By using
-C 0,1,2,3,...you can check each core state separately. -
Disk stats (-d, –disk) : Disk usage (read and write).
-D sda, dba, ...option shows each storage information separately. - Network stats (-c, –net) : Network throughput (send and receive).
-N eth0, eth1, ...option shows each network interface stat separately. -
Page stats (-g, –page) : Paging in/out stat
- System stats (-y, –sys) : System status including interrupts and context switches
Useful options
top-cpu: shows the most expensive CPU processtop-cputime: shows a process using the most CPU time (in ms)top-mem: shows a process using the most memorytop-io: shows the most expensive I/O process
Tip: the sequence of typed options match the statistics printed out. For instance, if you type dstat -dnc, dstat shows the disk, network, and CPU stats in order.